


Every day, our bodies follow an internal schedule—an invisible biological rhythm that governs not only when we sleep and wake, but how alert we feel, how efficiently we digest, how our hormones fluctuate, and how well we perform mentally and physically. This internal schedule is known as the circadian rhythm, and understanding it is crucial for optimizing health and longevity. While the concept of a biological clock may seem abstract, tools like the circadian chart and circadian rhythm graph translate this natural cycle into a visual language—making it easier to grasp how our bodies are programmed to function in harmony with time.
You may also like: How to Sleep Better at Night Naturally: Science-Backed Biohacks to Increase Deep Sleep and Prevent Insomnia Faster
This article explores the powerful connection between your body clock and these visual representations. We’ll unpack the science behind the circadian rhythm diagram, discuss how to read a circadian chart, and examine the practical applications for sleep, energy, mental focus, and even chronic disease prevention. With expert insights and research-backed knowledge, you’ll learn how to work with your body’s rhythm—not against it—to enhance your daily performance and long-term vitality.
The Science Behind Circadian Rhythms
Circadian rhythms are 24-hour biological cycles that regulate many physiological processes, including the sleep-wake cycle, hormone release, metabolism, and temperature control. These rhythms are governed by the brain’s master clock, the suprachiasmatic nucleus (SCN), located in the hypothalamus. The SCN receives light signals through the eyes and uses that information to synchronize internal processes with the external day-night cycle.
Although the SCN is the master pacemaker, peripheral clocks exist in virtually every organ and tissue, each of which follows its own circadian rhythm influenced by signals from the brain, light exposure, eating patterns, and physical activity. When these rhythms fall out of sync—due to poor sleep, irregular schedules, shift work, or artificial lighting—it can result in a host of health problems, ranging from fatigue and mood disturbances to metabolic disorders and even cancer.
This is where visual tools like the circadian rhythm diagram become helpful. They serve as a map of these processes, illustrating how our biology changes over time, and offering a framework for aligning daily behaviors to support better health.
What Is a Circadian Chart and How Does It Work?
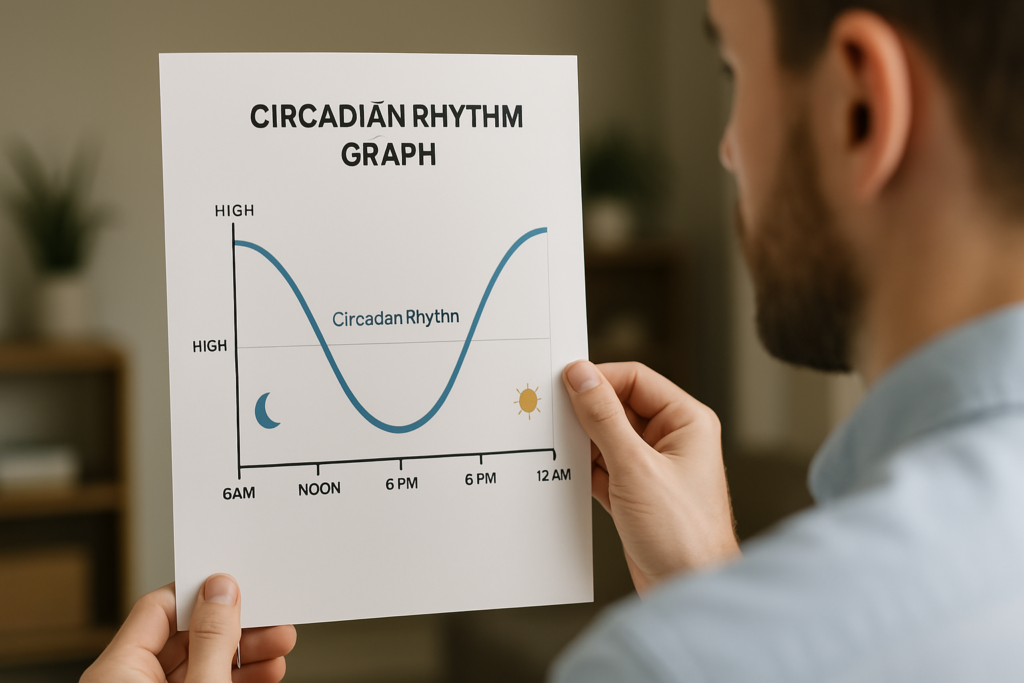
A circadian chart is a visual representation of the body’s natural 24-hour biological rhythm. It often outlines specific physiological milestones throughout the day—such as the highest alertness, fastest reaction times, or lowest body temperature—based on the average human biological clock. These charts help make the invisible cycle of circadian biology more understandable and actionable.
A typical circadian chart includes data points like when melatonin secretion begins (usually around 9 PM), when the body reaches its lowest core temperature (around 4 AM), and when cognitive performance peaks (typically late morning to early afternoon). These visualizations are not static but can vary based on individual chronotypes—whether you’re a natural early riser or a night owl. Still, the circadian rhythm graphic provides a standardized baseline to identify how specific times of day align with physiological strengths or vulnerabilities.
Circadian rhythm graphs are especially useful in clinical settings and performance training. Healthcare providers, coaches, and biohackers use them to fine-tune schedules for sleep, exercise, therapy, and medication—essentially, optimizing life based on internal timing rather than social constraints.
How the Circadian Rhythm Graph Translates Biology into Action
When viewed as a graph, the circadian rhythm comes to life. A typical circadian rhythm graph might chart hormone levels such as cortisol and melatonin, variations in core body temperature, and changes in alertness or reaction time. These metrics rise and fall in a predictable pattern over 24 hours.
For instance, cortisol, the body’s primary stress hormone, typically peaks around 7–8 AM to promote wakefulness and energy. Melatonin, the hormone responsible for inducing sleep, starts to rise as daylight fades, peaking in the early hours of the morning. Understanding this pattern helps individuals structure their day around times of peak energy and avoid engaging in cognitively or physically demanding tasks during low-performance windows.
By visually tracking these fluctuations, individuals can adjust their routines to align with their body’s optimal functioning windows. That’s the power of the circadian rhythm graph: it demystifies when your body is primed to perform, recover, or rest.
The Benefits of Using a Circadian Rhythm Diagram in Daily Life
Using a circadian rhythm diagram as a guide can lead to more intentional living. For example, scheduling deep work or creative tasks during periods of peak cognitive function—usually mid-morning to early afternoon—can dramatically improve productivity. Similarly, understanding that your body’s ability to digest food efficiently decreases in the evening can encourage earlier mealtimes, which supports metabolic health and weight regulation.
Athletes and high performers use circadian rhythm graphics to tailor training and recovery. Exercising during the late afternoon, when reaction times and strength levels tend to peak, may yield better results with lower injury risk. Sleep hygiene also improves when individuals use these visual tools to identify the ideal window for melatonin onset and adjust their bedtime accordingly.
Ultimately, these diagrams and charts provide a roadmap for aligning behavior with biology. They empower people to structure their lives around natural energy highs and lows rather than forcing their bodies into unnatural rhythms dictated by modern lifestyles.
How Technology Enhances Our Understanding of Circadian Rhythms
In recent years, wearable technology and digital health tools have made it easier to generate personalized circadian rhythm graphics. Devices like smartwatches and sleep trackers collect data on heart rate variability, temperature, movement, and light exposure. With the help of machine learning algorithms, this data can be transformed into an individualized circadian chart that reflects not just average trends, but your unique biological rhythm.
These personalized circadian rhythm graphs help identify discrepancies between your internal clock and your daily routine. For example, if your melatonin peak occurs later than expected, it may signal a delayed sleep phase or overexposure to artificial light. With this knowledge, you can take steps to shift your schedule or improve your sleep environment.
This integration of tech and biology makes circadian awareness more accessible and practical than ever. What was once the domain of chronobiologists and sleep scientists is now available to anyone with a smartphone and a desire to live more rhythmically.
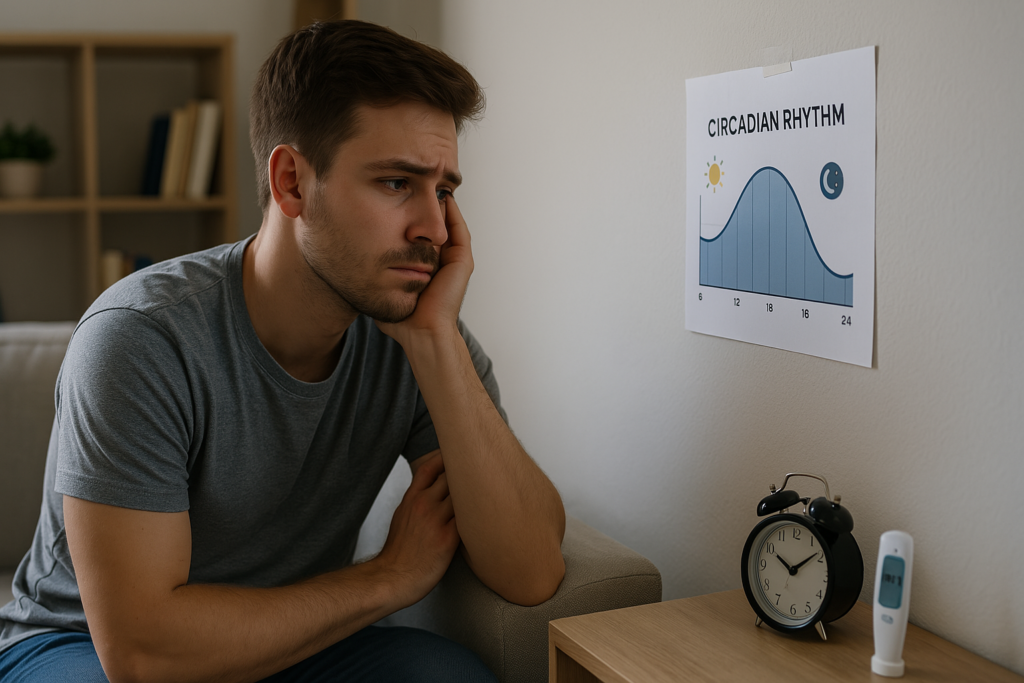
Misalignment and the Health Risks of Circadian Disruption
When the natural circadian rhythm is disrupted, health consequences can quickly follow. The modern lifestyle—with its irregular sleep schedules, high screen time, late-night eating, and 24/7 work culture—often conflicts with the biological blueprint visualized in a circadian rhythm diagram. This misalignment can throw off hormone secretion, immune response, digestion, and even cognitive processing.
Chronic circadian disruption is now associated with serious long-term health outcomes. Research published in journals such as Nature and The Lancet has linked circadian misalignment to obesity, type 2 diabetes, cardiovascular disease, depression, and neurodegenerative conditions like Alzheimer’s. Even the World Health Organization classifies night shift work as a probable carcinogen due to its impact on melatonin suppression and DNA repair processes.
A circadian rhythm graph offers early warning signs when your lifestyle starts veering off-course. If your daily energy patterns or temperature cycles show flattening or irregularity, it may be time to reevaluate your sleep hygiene, meal timing, and exposure to light.
How to Use a Circadian Chart to Improve Sleep and Energy
One of the most practical uses of a circadian chart is to guide sleep and energy management. For most people, melatonin secretion begins around 9 PM, reaching its peak between 2–4 AM. Core body temperature drops during this time, supporting deep sleep and cellular recovery. A circadian rhythm graphic clearly shows how this cooling process aligns with restorative sleep phases.
By going to bed before your core temperature reaches its lowest point, you allow your body to naturally progress into deeper stages of non-REM sleep. Waking up in alignment with your natural cortisol peak—usually around 6–8 AM—ensures smoother transitions into alertness and productivity.
Many people who struggle with insomnia or morning grogginess find resolution by analyzing their daily schedule through the lens of a circadian rhythm diagram. Gradually adjusting bedtime, limiting blue light exposure in the evening, and maximizing natural light in the morning can realign internal rhythms and improve energy stability throughout the day.
Real-World Applications of Circadian Rhythm Graphics
The influence of circadian science extends far beyond individual sleep and wellness habits. Industries ranging from aviation to healthcare are now leveraging circadian rhythm graphics to enhance performance and safety. Airlines use circadian charts to manage pilot fatigue and improve flight schedules. Hospitals are beginning to coordinate surgery times with circadian cycles, recognizing that outcomes may vary based on the time of day a procedure is performed.
In education, circadian insights have sparked debates about school start times, especially for adolescents whose internal clocks naturally shift later. Some districts have already adjusted schedules based on circadian chart evidence, resulting in better academic performance and reduced absenteeism.
Workplaces are also using circadian rhythm graphs to implement flexible hours and optimize productivity. Employees who work during their biological peak hours tend to be more efficient, engaged, and creative. From boardrooms to bedrooms, the circadian rhythm diagram is quickly becoming a central tool for human optimization.
Frequently Asked Questions
1. What is a circadian chart and how can it help me?
A circadian chart is a visual timeline of your body’s 24-hour biological rhythm. It shows when you’re likely to be most alert, when your core temperature peaks, when melatonin starts to rise, and other key physiological events. By aligning your daily activities—like sleep, work, meals, and exercise—with this chart, you can improve your performance, energy, and overall health. It provides a simple yet powerful way to interpret your body’s natural timing. Think of it as a daily blueprint for optimal functioning.
2. How accurate are circadian rhythm graphs for everyone?
Circadian rhythm graphs are typically based on population averages, which means they may not be perfectly accurate for every individual. However, they provide a helpful general framework for understanding how the human body operates on a 24-hour cycle. With the help of wearable technology, individuals can now generate personalized circadian rhythm graphics that better reflect their unique biological patterns. These custom charts allow for greater precision in optimizing sleep, activity, and energy management.
3. What does a circadian rhythm diagram typically include?
A standard circadian rhythm diagram includes time-marked events like melatonin secretion onset, cortisol peak, maximum alertness, lowest body temperature, and sleep phases. It visually maps out how these markers rise and fall throughout the day. The diagram helps clarify when the body is primed for different tasks, such as physical exertion, digestion, or rest. It’s a versatile tool used in health coaching, performance optimization, and clinical settings. It translates biology into practical guidance.
4. Can a circadian chart help with jet lag?
Yes, circadian charts are a powerful tool for managing jet lag. They help you anticipate when your body will want to sleep or be active based on your internal clock, not just local time. By planning light exposure, meals, and sleep around a circadian chart before and after travel, you can ease the transition between time zones. This approach helps resynchronize your internal rhythms with the new environment more quickly. It’s especially useful for frequent travelers and airline crews.
5. How do circadian rhythm graphics relate to shift work?
Shift workers often experience circadian disruption because their schedules are misaligned with their internal biological clock. Circadian rhythm graphics illustrate the mismatch between when the body wants to sleep or eat and when it’s required to be active. By using these visuals, employers and workers can identify windows of vulnerability and build better schedules. Strategic use of light, food timing, and short naps—guided by the circadian rhythm graph—can mitigate health risks associated with shift work.
6. Can I use a circadian diagram to time my workouts?
Absolutely. The circadian rhythm diagram reveals that physical performance often peaks in the late afternoon, when body temperature and reaction time are at their highest. This is an ideal time for strength training, endurance workouts, or sports. If morning exercise is necessary, using light and caffeine strategically can help shift your rhythm to support earlier activity. By working with your body’s natural cycles, you reduce injury risk and maximize performance gains.
7. Are circadian rhythm diagrams useful for children and teens?
Yes, they’re especially helpful for understanding the sleep needs and behavior of children and adolescents. Teenagers, for instance, naturally experience a delayed circadian phase, making them biologically inclined to sleep and wake later. Circadian diagrams can help parents and educators recognize these shifts and adjust routines accordingly. Aligning school schedules with biological rhythms has been shown to improve academic performance and mental health. These charts promote compassion and smarter planning.
8. What tools can I use to generate my own circadian rhythm graph?
Many wearable devices and sleep tracking apps now offer tools to create personalized circadian rhythm graphs. Devices from brands like Oura, WHOOP, and Fitbit collect biometric data like temperature, movement, and heart rate. These metrics are analyzed to infer circadian patterns and displayed in visual formats. Some apps also provide insights on how to adjust routines to better align with your body clock. These tools make biohacking accessible and data-driven.
9. Can a circadian rhythm graphic help manage chronic conditions?
Yes, managing chronic conditions like diabetes, depression, or cardiovascular disease can benefit from aligning behaviors with circadian rhythms. For example, taking medication at specific times—known as chronotherapy—can improve efficacy and reduce side effects. Circadian rhythm graphics help visualize the best times for meals, activity, and rest to support stable blood sugar, hormonal balance, and recovery. This approach is increasingly used in integrative and functional medicine practices.
10. How often should I adjust my schedule based on a circadian chart?
While major adjustments may not be needed frequently, it’s wise to revisit your schedule when you experience changes in energy, mood, sleep, or lifestyle. Circadian charts provide a flexible foundation that can evolve with your needs. If you’re recovering from illness, adjusting to a new job, or entering a new life stage, recalibrating your routine using a circadian rhythm graph can enhance resilience and well-being. Ongoing reflection and responsiveness are key to living in sync.

Conclusion
The circadian rhythm is not just a theoretical concept—it is a living, breathing pattern woven into every cell of your body. By visualizing it through a circadian chart or circadian rhythm graph, we gain powerful insight into when our bodies are primed to perform, rest, heal, and thrive. These diagrams and graphics are more than educational tools; they are guides to a more aligned, energized, and health-conscious life.
As science continues to validate the importance of timing in human biology, more people are turning to the circadian rhythm diagram to guide decisions—from when to sleep to when to speak, move, eat, or even think. With this understanding, you can begin to reorient your lifestyle around your biological strengths, reduce risk of disease, and unlock greater vitality.
In a world that never sleeps, learning to honor your body’s natural rhythms may just be the most radical and rewarding form of biohacking there is.
internal clock optimization, biological rhythms and health, daily energy cycle, sleep-wake timing, natural hormone fluctuations, personalized sleep strategies, body clock reset tips, chronotype awareness, melatonin cycle management, cortisol rhythm insights, optimal meal timing, high-performance biohacking, sleep science education, alertness and focus mapping, wearable sleep tracking, light therapy timing, chronobiology for wellness, shift work adaptation, circadian-based productivity, health tracking visualization
Further Reading:
Disclaimer
The content provided by HealthXWire is for informational purposes only and should not be construed as medical advice, diagnosis, or treatment. While we strive for accuracy, the information presented on this site may not reflect the most current research or medical guidelines. Always seek the advice of your physician or other qualified health provider with any questions you may have regarding a medical condition. HealthXWire does not endorse, recommend, or guarantee the efficacy of any products, services, or treatments mentioned on this site. Users should not disregard professional medical advice or delay seeking it because of something they have read on HealthXWire. HealthXWire is not liable for any damages, loss, or injury arising from reliance on the information provided herein.